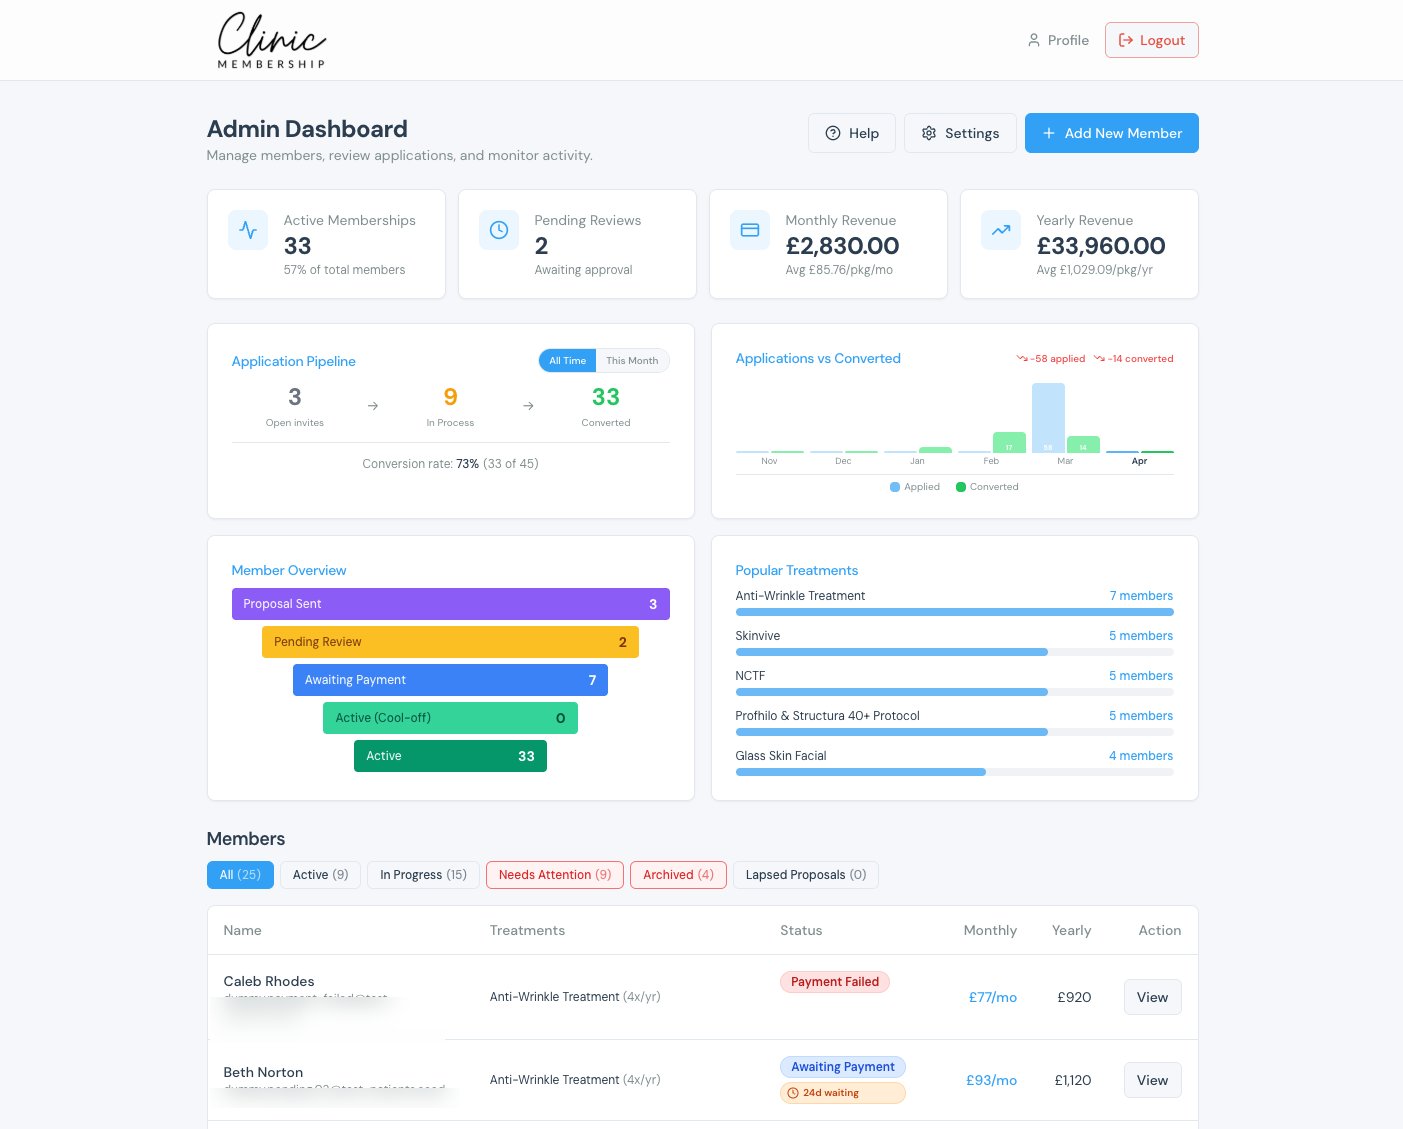


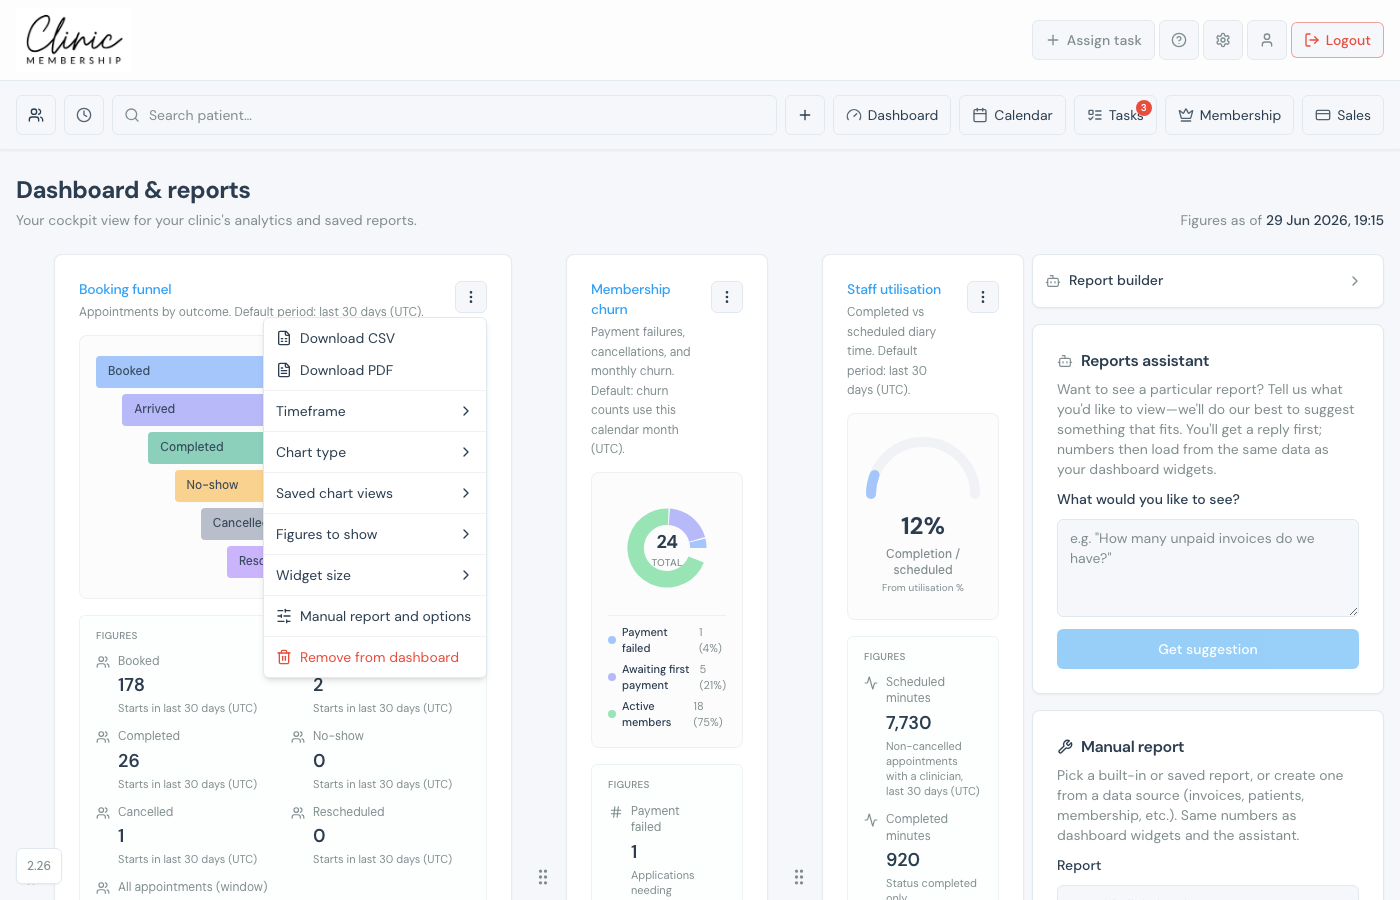
Each tile on Dashboard & reports is a live widget. On desktop you can drag tiles to reorder them. Use the three-dot menu on any widget to export data or change how it looks.
Reorder widgets
- On a desktop browser, press and hold the drag handle on a widget card.
- Drag it to a new position in the grid.
- Layout saves automatically for your clinic.
Widget menu (three dots)
Click the ⋮ menu on a widget header to:
- Download CSV or Download PDF, export the current figures.
- Timeframe, rolling windows such as last 7 days, last 30 days, or this month.
- Chart type, bar, line, or other views where the widget supports them.
- Figures, show or hide specific KPI rows under the chart.
- Widget size, standard, wide (two columns), or full width.
- Remove from dashboard, hide a tile without deleting the underlying report.
Tip
Saved views let you store a favourite combination of chart type and figures on widgets that support them, useful for owner vs reception dashboards.